


Russell J. Donnelly
541-346-4226 (Tel)
541-346-5861 (Fax)
![]()
| <<Previous | Page1 | Page2 | Page3 | Page4 | Page5 | Page6 | Page7 | Next>> |
![]() Table
1 : : 2 : : 3
: : 4 : : 5
Table
1 : : 2 : : 3
: : 4 : : 5
Saturated Vapor Pressure
![]() The
Calculated Thermodynamic Properties of Superfluid Helium-4
The
Calculated Thermodynamic Properties of Superfluid Helium-4
![]() James S. Brooks and Russell J. Donnelly
James S. Brooks and Russell J. Donnelly
![]()
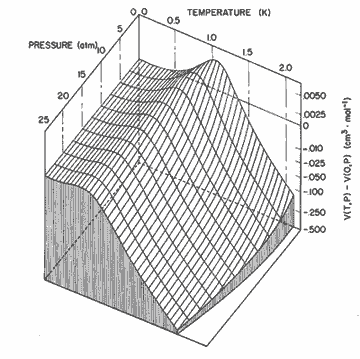
Figure 8. The relative change in molar volume given by the expression in table I. The nonlinear scale is chosen to emphasize the locus of maximum molar volume, or zero thermal expansion.
![]()
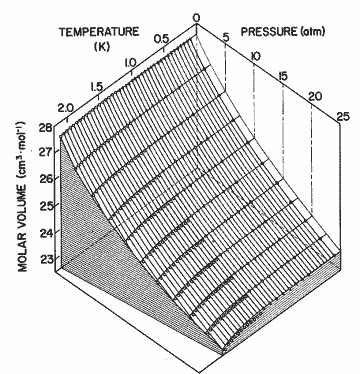
Figure 9. The P-V-T surface of helium II. Solid lines come from the expression in table I; open circles, Elwell and Meyer[33]; open triangles, Boghosian and Meyer [32]; solid circles, Abraham et al. [31]; solid triangles, Kerr and Taylor [34]. The deviation between calculation and the data may be seen as a difference perpendicular to the P-T plane. The experimental data have been numerically interpolated to 5 atm intervals in pressure.
![]()
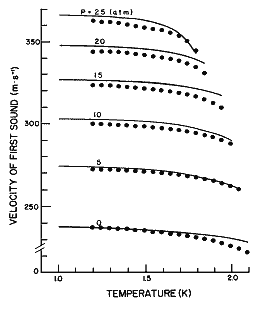
Figure 10. The velocity of first sound as a function of temperature for different pressures calculated from eq (25). Data points from Heiserman et al. [21].
4.2.b. The Isothermal Compressibility
The
isothermal compressibility, which is defined as
![]()
![]()
is
obtained by noting that V(T, P)
= V(0, P) + ![]() V(T,
P) from table I. The derivative V(T, P)=V(O,
P) +
V(T,
P) from table I. The derivative V(T, P)=V(O,
P) + ![]() V(T,
P) is calculated separately for the two terms, resulting in more
reliable results than differentiating the total molar volume directly.
The results are in table 4.
V(T,
P) is calculated separately for the two terms, resulting in more
reliable results than differentiating the total molar volume directly.
The results are in table 4.
The first term kT(0)can be compared directly with the data
of table V of Boghosian and Meyer [32]. The deviations ![]() K
K
![]() (keale
- kmeas)/kmeas range from + 4.1% to -5.0%. However,
we believe that our data, derived from the later measurements of Abraham
et al. [31] are considerably more reliable. Since the contribution from
the temperature dependent part of V is so small, the deviations quoted
are the dominant ones at all temperatures up to 1.25 K, the highest reported
by Boghosian and Meyer [32].
(keale
- kmeas)/kmeas range from + 4.1% to -5.0%. However,
we believe that our data, derived from the later measurements of Abraham
et al. [31] are considerably more reliable. Since the contribution from
the temperature dependent part of V is so small, the deviations quoted
are the dominant ones at all temperatures up to 1.25 K, the highest reported
by Boghosian and Meyer [32].
Elwell and Meyer [33] report measurements Of kT
in the range above 1.2 K. Comparing with their tables IV and V, we find
the pressure averaged deviations ![]() k
to be + 0, - 2.4% at 1.3 K; and + 0, - 2.0% at 1.8 K.
k
to be + 0, - 2.4% at 1.3 K; and + 0, - 2.0% at 1.8 K.
Our computed values of the compressibility are not sufficiently accurate
near the lambda line to exhibit the peak structure observed by Grilly
[42].
4.2.c. The
Grüneisen Constant
Another quantity which appears
in expressions for the ultrasonic attenuation and dispersion in helium
II is the Grüneisen constant, defined as
![]()
![]()
| TABLE
III. The Grüneisen constant UG |
||||||
T(K) |
P(atm) |
|||||
| 0 | 5 | 10 | 15 | 20 | 25 | |
| 0.0 | 2.843 | 2.608 | 2.460 | 2.356 | 2.276 | 2.212 |
| 0.5 | 2.842 | 2.608 | 2.460 | 2.356 | 2.275 | 2.213 |
| 1.0 | 2.842 | 2.624 | 2.466 | 2.339 | 2.270 | 2.194 |
4.2.d. The Coefficient of Thermal Expansion
The
thermal expansion coefficient is a temperature derivative of the equation
of state:
![]()
![]()
It
is, however, directly calculated from the integral expression of Roberts
and Donnelly given in table I.
We experienced great difficulty with ![]() P
because it is a very small quantity which passes through zero near 1 K.
Our calculations, listed in table 5 and illustrated in figure 11, are
sufficiently accurate to give a good account of the locus of zero expansion
indicated by the dashed line in figure 2. We have also managed to keep
the deviations from growing rapidly above 1.6 K as they did in our earlier
work [18, 19]. The temperature. averaged deviations
P
because it is a very small quantity which passes through zero near 1 K.
Our calculations, listed in table 5 and illustrated in figure 11, are
sufficiently accurate to give a good account of the locus of zero expansion
indicated by the dashed line in figure 2. We have also managed to keep
the deviations from growing rapidly above 1.6 K as they did in our earlier
work [18, 19]. The temperature. averaged deviations ![]()
![]() P
= (
P
= (![]() Pcalculated-
Pcalculated-![]() Pmeasured)/
Pmeasured)/ ![]() Pmeasured
follow:
Pmeasured
follow:
P(atm) |
0 |
5 |
10 |
15 |
20 |
25 |
| 14 | 16 | 34 | 0.8 | 1.1 | 1.6 | |
| 16 | 3.2 | 8 | 9 | 10 | 11 |
Except
for the vapor pressure, where the systematic work of Van Degift exists,
the experimental situation on ![]() P
is quite unsatisfactory and the data often in mutual conflict. A systematic
study over the entire T-P plane would be of great benefit in
reducing the deviations listed above.
P
is quite unsatisfactory and the data often in mutual conflict. A systematic
study over the entire T-P plane would be of great benefit in
reducing the deviations listed above.
The density and expansion coefficient have been investigated recently,
but only at the SVP. The reference is J. J. Niemela and R. J. Donnelly,
J. Low Temperature Physics 98 1-16, (1995).
![]()
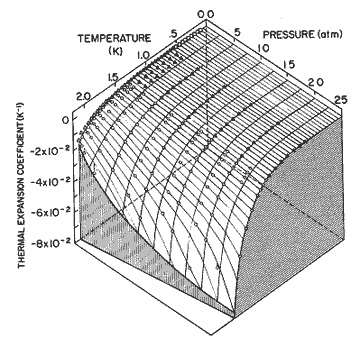
Figure 11. The thermal expansion coefficient as a function of pressure and temperature. The solid lines are calculated from the expression in table I; circles, Elwell and Meyer [33]; solid triangles, Boghosian and Meyer [32]; open triangles, Van DeGrift [20]; open diamonds, Kerr and Taylor[34].
4.3. The Fundamental Thermodynamic Functions
In this section we describe our use of the Landau theory . and the effective spectrum to compute the thermodynamic properties of helium II.
4.3.a. The Entropy
The
entropy is the fundamental quantity used to find e effective spectrum.
Deviations, then, reflect imperfections in the data itself -as well as
the effective spectrum. The temperature averaged deviations ![]() S
= (Scalc.-Smeas)/Smeas are as follows:
S
= (Scalc.-Smeas)/Smeas are as follows:
P(atm) |
0 |
5 |
10 |
15 |
20 |
25 |
| 0.7 | 1.5 | 1.2 | 0.5 | 0.6 | 0.2 | |
| 3.9 | 2.6 | 2.4 | 2.5 | 2.8 | 2.0 |
The entropy is listed in table 9 and plotted in figure 12.
4.3.b. The Helmholtz Free Energy
Table
I shows that the Helmholtz free energy F consists of a ground
state part Fo(V) and an excitation part FE given by the double
integral over the spectrum. Fo(V) can be determined by integrating the expression dFo=-PdV.. The results give Fo at T = 0
K to within an additive constant Lo [Lo
= F (0, 0) = ![]() (0,
0)] where Lo is the latent heat
of vaporization extrapolated to zero temperature, and is approximately
14.90 J g-1. L is a measure of the energy required
to separate the atoms of the liquid to infinity.
(0,
0)] where Lo is the latent heat
of vaporization extrapolated to zero temperature, and is approximately
14.90 J g-1. L is a measure of the energy required
to separate the atoms of the liquid to infinity.
| Table IV. The ground state Helmholtz free energy Fo(P)=[F (0, P) -F (0,0)]J g-1 | ||||||
| P(atm) | 0 | 2.5 | 5 | 7.5 | 10 | 12.5 |
| F0(V) (J.g-1) |
0 | 0.0232554 | 0.082368 | 0.16671 | 0.26980 | 0.38737 |
| P(atm) | 15 | 17.5 | 20 | 22.5 | 25 | |
| F0(V) (J.g-1) |
0.51645 | 0.65490 | 0.80111 | 0.95385 | 1.1122 | |
The
Helmholtz free energy is not a directly accessible quantity, and no comparison
with experimental data can be readily made. However, table IV comes from
the equation of state of Abraham et al. [31] and should be quite accurate.
The excitation free energy is tabulated in table 6 and plotted in figure
13. The derivative (![]() n
/
n
/ ![]() q)
in the expression for F in table I is taken at constant volume. We approximated
it by constant pressure. In order to check the accuracy of our calculation,
we computed -
(
q)
in the expression for F in table I is taken at constant volume. We approximated
it by constant pressure. In order to check the accuracy of our calculation,
we computed -
(![]() F
/
F
/ ![]() T)at
constant pressure and compared it to S. Except at the highest temperatures
and pressures, the error in our procedure is generally less than 1% and
never more than 2.2%.
T)at
constant pressure and compared it to S. Except at the highest temperatures
and pressures, the error in our procedure is generally less than 1% and
never more than 2.2%.
![]()
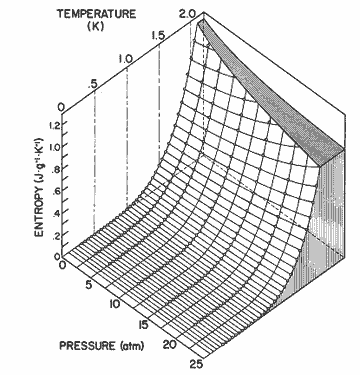
Figure
12. The entropy of helium II as a function of pressure and temperature
calculated from equation (2). The data for 0.3 ![]() T
T ![]() 1.6 is
from Wiebes [36], and for 1.6
1.6 is
from Wiebes [36], and for 1.6 ![]() T
T ![]() 2.05 is
from Van den Meijdenberg et al. [35].
2.05 is
from Van den Meijdenberg et al. [35].
|

