


Russell J. Donnelly
541-346-4226 (Tel)
541-346-5861 (Fax)
![]()
| <<Previous | Page1 | Page2 | Page3 | Page4 | Page5 | Page6 | Page7 | Next>> |
![]() Table
1 : : 2 : : 3
: : 4 : : 5
Table
1 : : 2 : : 3
: : 4 : : 5
Saturated Vapor Pressure
![]() The
Calculated Thermodynamic Properties of Superfluid Helium-4
The
Calculated Thermodynamic Properties of Superfluid Helium-4
![]() James S. Brooks and Russell J. Donnelly
James S. Brooks and Russell J. Donnelly
1. Introduction
Liquid
helium is a rewarding subject for the study of thermodynamic properties,
especially because helium II, the lower temperature phase, exhibits the
property of superfluidity. The hydrodynamics of this phase are extraordinary:
both normal viscous behavior and superflow may be exhibited in closely
related experiments. Phenomenologically, one speaks of a "two-fluid"
behavior in which the fluid (of density p)1
acts dynamically as if a fraction of effective density pn
flows as a normal fluid, and a fraction of effective densityps
= p - pn flows as an inviscid fluid.
This two-fluid motion of helium II leads to some very unusual results,
such as the wave-like rather than diffusive propagation of temperature
fluctuations (called second sound). Furthermore, the thermodynamic properties
are deeply related to the hydrodynamic: for example, the Gibbs free energy
is related to the square of the relative velocity between the two fluids.
We shall be concerned principally with the static properties of helium
IIin which all net flow velocities are zero.
On a deeper level, one has the Landau picture [1] 2 in which the entire
fluid is superfluid at absolute zero. As the temperature 3 is raised,
the heat content is described entirely in terms of "elementary excitations"
of the superfluid. At low temperatures these are "phonons",
at higher temperatures more complex excitations called "rotons"
are excited.
The energy ![]() and momentum p(
=
and momentum p(
=![]() q) of the
elementary excitations in superfluid helium may be represented by the
excitation spectrum (dispersion curve) first proposed by Landau [1] which
is shown schematically in figure 1. We will refer again to this figure
in subsequent sections. In recent years many of the features, and in some
cases the entire dispersion curve, have been measured by inelastic thermal
neutron scattering techniques for different pressures and temperatures.
(See for example references [2-10].) Landau has put forth a simple but
elegant theory which allows one to calculate the thermodynamic properties
of He II at low temperatures from the excitation spectrum.
q) of the
elementary excitations in superfluid helium may be represented by the
excitation spectrum (dispersion curve) first proposed by Landau [1] which
is shown schematically in figure 1. We will refer again to this figure
in subsequent sections. In recent years many of the features, and in some
cases the entire dispersion curve, have been measured by inelastic thermal
neutron scattering techniques for different pressures and temperatures.
(See for example references [2-10].) Landau has put forth a simple but
elegant theory which allows one to calculate the thermodynamic properties
of He II at low temperatures from the excitation spectrum.
![]()
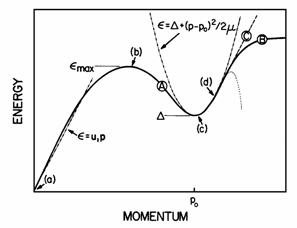
Figure 1 A Schematic diagram of the excitation spectrum for helium II. Details and labels are discussed in the text.
![]()
 Temperature
(K)
Temperature
(K)
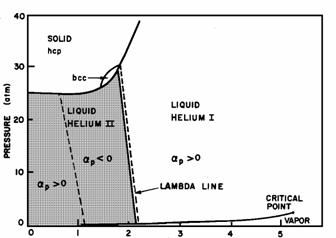
Figure
2. A schematic phase diagram for helium-4. The pressure of the liquid-gas
transition line has been exaggerated. The hexagonal close-packed and body
centered cubic (bcc) phases of the solid are shown, as are the loci of
zero thermal expansion (dashed lines).
The
purpose of this paper is to give an account of the equilibrium thermodynamic
properties of He II and related quantities such as the velocities of first,
second, and fourth sounds and properties of the excitations themselves.
These quantities are used in a wide variety of contexts, both experimental
and theoretical; and it is often important that the data for different
properties be thermodynamically consistent. The ideal solution to this
problem would be a critical compilation of experimental properties over
the entire T-P plane for He II, and some day this will undoubtedly be
possible. At the time this project was begun (1972), the tables in the
appendices of the books by Wilks [11] and Donnelly [12] were the most
complete available, and far from adequate for the task undertaken here.
Another promising avenue is the use of Landau's theory mentioned above.
The thermodynamic properties along the vapor pressure curve have been
extracted from neutron scattering measurements with reasonable success
by Bendt, Cowan, and Yarnell [10]. We have, then, the possibility that
direct thermodynamic measurements can be supplemented by the increasing
body of neutron data indicated by the references cited. In particular,
we were greatly encouraged by the appearance in 1972 of the landmark study
of neutron scattering from rotons by Dietrich, Graf, Huang, and Passell
at Brookhaven National Laboratory [3].
The superfluid region of the helium P-T phase diagram is shown
schematically as the shaded portion of figure 2. It is to this area that
our analysis and subsequent tabulations apply. For all pressures in this
shaded region, there is a temperature ![]() above which
the superfluid properties cease to exist, and one has a classical liquid
phase (called helium I). The line which separates these two regions is
called the lambda line, in recognition of the characteristic anomaly in
the specific heat observed along this line. In this paper, we do not treat
the thermodynamic properties in the immediate vicinity of this line. Such
a treatment has, however, been undertaken in an earlier volume of this
Journal, by McCarty [13], who has reported on the thermodynamic properties
of helium I; and IUPAC Helium-4 tables by Angus, de Reuck, and McCarty
[14] are in the process of completion at the time of writing of the present
article.
above which
the superfluid properties cease to exist, and one has a classical liquid
phase (called helium I). The line which separates these two regions is
called the lambda line, in recognition of the characteristic anomaly in
the specific heat observed along this line. In this paper, we do not treat
the thermodynamic properties in the immediate vicinity of this line. Such
a treatment has, however, been undertaken in an earlier volume of this
Journal, by McCarty [13], who has reported on the thermodynamic properties
of helium I; and IUPAC Helium-4 tables by Angus, de Reuck, and McCarty
[14] are in the process of completion at the time of writing of the present
article.
The results described here are the result of a lengthy series of investigations
by our research group at the University of Oregon. The first product of
our analysis of the Brookhaven data was a report on the Landau parameters
[15]. An early attempt at approximating the dispersion curve in a piecewise
fashion was reported at LT13 [16]. This proved to be imprecise and was
succeeded by the series representation used in this paper [17]. The results
of these investigations were summarized in the Ph. D. thesis of J. S.
Brooks, which appeared in 1973 [18]. We issued the Tables from that thesis
in the form of a University of Oregon Technical Report in December 1973
[19], requesting contributions from other laboratories. We were gratified
to receive a number of suggestions, corrections, and reports of new experimental
work. In particular, the thesis of Van Degrift on the expansion coefficient
[20], and a systematic study of first, second, and fourth sound by Maynard
and Rudnick, began at UCLA, have been extremely useful, as has some independent
work on dispersion curves by Dr. Maynard [21]. Since this work was submitted,
the UCLA measurements have been completed and sent for publication as
shown in [21].
The problem of the proper treatment of the statistical mechanics of interacting
Bose excitations has taken considerable effort. Much confusion about the
effects of temperature dependent levels and thermal expansion has been
removed with the recent appearance of papers by Goodstein, Brooks, Donnelly,
and Roberts [22], Roberts and Donnelly [23, 24]. In particular, the latter
authors have developed the set of expressions displayed in table I which
allow the calculation of the equilibrium properties of He II when the
energy levels of excitations are known from experiment. This is the basis
of the present calculated tables, which represent a considerable advance
in accuracy over the calculations in our early work [18, 19]. For example,
the need for an empirical equation of state is eliminated altogether.
The
computations reported here have been carried out by James Gibbons on a
Hewlett-Packard 2100 A computer.
2. Theoretical Background
Although several authors have discussed the Landau spectrum and theory in detail (see, for example, Wilks [11], Donnelly [12], Keller [25], Khalatnikov [26]) we present here a brief description for completeness. Landau's theory for superfluid helium is based on the assumption that the thermal excitations in the liquid can be described as constituting a weakly interacting gas with the energy spectrum given as the solid line in figure 1. It is also assumed that these excitations obey Bose statistics, and therefore the number density of excitations of a particular momentum,n (p) is given by
![]()
![]()
From
this expression, we see that the low-lying regions of the energy spectrum
will contribute predominantly to the thermodynamic properties, and referring
to figure 1 we find that there are two such regions on interest. The first
is for small momenta, where the spectrum is approximately linear, and
is called the phonon branch. The other is the energy minimum about momentum
po,
which is nearly parabolic and is called the roton branch, or roton minimum.
Here the energy is much higher, but the density of states is also very
large.
The experimentally observed values of the minimum roton energy ![]() are
large enough that the Boltzmann distribution is an adequate approximation
to eq (1). As a rough guide to thinking of the thermodynamics of helium
II, it is sufficient to recognize that below 1 K, the phonon excitations
are the more numerous and dominate the thermal properties, whereas at
higher temperatures the number of rotons increases exponentially with
temperature, and rotons become predominant thermodynamically above 1 K.
are
large enough that the Boltzmann distribution is an adequate approximation
to eq (1). As a rough guide to thinking of the thermodynamics of helium
II, it is sufficient to recognize that below 1 K, the phonon excitations
are the more numerous and dominate the thermal properties, whereas at
higher temperatures the number of rotons increases exponentially with
temperature, and rotons become predominant thermodynamically above 1 K.
If one knows the dispersion curve of the excitations, it is straightforward
to construct a partition function and proceed by standard statistical
mechanical methods to compute the entire set of equilibrium properties
of the liquid. As we shall see, this ideal is far from realizable today.
At very low temperatures, when the liquid is relatively free of excitations,
inelastically scattered neutrons are observed to form a very sharp spectrum,
limited only by the instrumental resolution of the analyzing spectrometer.
The location of this spectral line is taken as a measure of the transfer
of energy from the incoming neutron beam to single phonons in the liquid,
for a given momentum transfer p set by the spectrometer. The
result of many such measurements is an excitation spectrum such as is
shown in figure 3. It appears theoretically reasonable, and experimentally
fairly certain, that the observed excitation spectrum can be identified
with the dispersion curve of the elementary excitations in the fluid at
low temperatures.
![]()
Figure 3. The experimentally determined excitation spectrum at 1.1 K, SVP. The dots are the neutron scattering data of Cowley and Woods [2]; the solid line is eqs (20) and (14). The error bar is the smallest experimental error, and is not to be associated with any one data point.
At
higher temperatures, however, Yarnell et al. [9], and Henshaw and Woods
[5] observed that the widths of the scattered spectra increase rapidly
with temperatures. For rotons (at (c) in fig. 1) the linewidths, as measured
by the half-width at half maximum ?, approach the magnitude of the energy
itself as ![]() approaches
approaches ![]() (i.e.,
(i.e.,![]() as
as![]() ). This
means, among other things, that the lifetimes of the excitations are decreasing
rapidly with increasing temperature. Furthermore, the roton energy ? is
observed to decrease with increasing T and increasing P.
). This
means, among other things, that the lifetimes of the excitations are decreasing
rapidly with increasing temperature. Furthermore, the roton energy ? is
observed to decrease with increasing T and increasing P.
The scattered neutron intensity is proportional to the dynamic structure
factor S (q. w)
which is in turn related to density-density correlations in the
fluid. The unfolding of the experimental scattered neutron spectra in
terms of assumed forms for S (q. w)
has been discussed in detail by Dietrich et al. [3]. To the best of our
knowledge at the time of writing, no one has been able to make a rigorous
connection between S (q. w) at finite temperatures and the energies which enter the
thermodynamic calculations. Dietrich et al. [3] have included the linewidth
? in their thermodynamic calculations in an ad hoc way; perhaps a complete
theory will require considerable information on the observed line shape.
If one were to brush aside the considerations of the last paragraph and
try to work with the unfolded dispersion curve ![]() ,
one would still have the problem of treating the statistical mechanics
of interacting Bose excitations whose interactions are manifested by an
observed dependence of
,
one would still have the problem of treating the statistical mechanics
of interacting Bose excitations whose interactions are manifested by an
observed dependence of ![]() on
T and P. Bendt, Cowan, and Yarnell [10] argue that when
on
T and P. Bendt, Cowan, and Yarnell [10] argue that when
![]() is
a function of T alone, the entropy should be given by
is
a function of T alone, the entropy should be given by
![]()
![]()
where
n is the Bose distribution function (1). Roberts and Donnelly [23]
have presented arguments to show that even at arbitrary T and
P, (1) and (2) are still valid, provided ![]() is available from experiment. They have presented a way in which all the
thermodynamic properties may be consistently deduced from experimental
dispersion curves [24]. We show in table I the expressions which they
have derived for the quantities of interest in the present study. In table
I we have omitted the subscripts on
is available from experiment. They have presented a way in which all the
thermodynamic properties may be consistently deduced from experimental
dispersion curves [24]. We show in table I the expressions which they
have derived for the quantities of interest in the present study. In table
I we have omitted the subscripts on ![]() and kT
for clarity.
and kT
for clarity.
Table I. Expressions for thermodynamic quantities
|
3. Experimental Data Used in the Analysis
In this section the experimental data underlying the Landau theory is discussed
3.1. Data Obtained by the inelastic Scattering of Thermal Neutrons from Helium II
The energies and line widths of the elementary excitations of helium II are obtained from examination of inelastically scattered thermal neutrons. The techniques are discussed in detail, for example, in a recent review article by Woods and Cowley [8]. We shall use the measured energy spectrum, following Bendt, Cowan, and Yarnell [10], as the basis for our computations of the thermodynamic properties of helium II from the Landau theory. A completely determined experimental excitation spectrum is shown in figure 3 for T = 1.1 K, at the SVP. The shape of this spectrum is a complicated function of pressure and temperature, and to use the Landau theory one must first know the detailed spectrum for every value of P and T. A complete set of data for a single pressure and temperature such as is shown in figure 3 is a major experimental undertaking. Hence it is necessary to find a method of estimating the energy spectrum for general P and T accurate enough that derivatives such as appear in table I may be accurately determined. In the sections below, we discuss the salient features of the excitation spectrum obtained from various kinds of experiments, and in section 3.1.e we describe a method of representing the spectrum as a power series in momentum, with pressure- and temperature-dependent coefficients.
3.1.a. The Phonon Branch
For momentum p decreasing to zero, the phonon branch of the energy spectrum approaches linearity, in accordance with theoretical predictions (cf. Feenberg [27]). Here we take the energy spectrum, as indicated at (a) in figure 1, to be
![]()
![]()
where
u1 is the velocity of ultrasonic (first) sound, a temperature- and pressure-dependent
quantity which may be determined experimentally either from the slope
of the excitation spectrum in the zero momentum limit, or more conveniently
from experimental first sound data (see section 4.2.a).
The first non-linear terms correcting eq. (3) for small, but non-zero,
momenta have been the subject of much controversy in the literature in
recent years (see Svensson, Woods, and Martel [7], and references there
in). These terms may affect the behavior of, for example, the specific
heat at temperatures below 0.45 K, as suggested by Phillips, Waterfield,
and Hoffer [28]. We will return to this question in section 3.1.e.
3. 1.b. The Maxon Branch
The
elementary excitations which have energies at or near the first energy
maximum, (b) in figure 1, have come to he called "maxons". This
part of the spectrum has been measured at
1.1 K, at the vapor pressure as indicated in figure 3, and the peak position
has been determined for various pressures at 1.18 K by Graf, Minkiewicz,
Møller, and Passell [6] Measurements have also been made by Henshaw
and Woods at the vapor pressure and 25.3 atm [4]. From the existing data
on the maxon part of the spectrum, we conclude that ,the peak energy is
density dependent only, since no shift in the peak position in momentum
space has been observed. Very little data exists on the temperature dependence
of the maxon peak. Figure 1 of Bendt, Cowan, and Yarnell [10] and figure
20 of Cowley and Woods [2] suggest it decreases. slowly with temperature,
Because the maxon energies are relatively high, their contribution to
the thermal properties is very small, and the details of this part of
the spectrum are not critical to the computations in this paper.
We represent the density dependence of the maxon energy by the expression
![]()
![]()
where
is the density at T= 0 and the coefficients En are
E0 = -216.5672 (K)
E1 = 3998.6005 (K g-1 cm3)
E2 = -23028.6027 (K g-2 cm6)
E3 = 44199.7232 (K g-3 cm9)
Equation 4a is a fit to the neutron data of Cowley and Woods [2] and Graf et al. [6] and is plotted with the data in figure 4. The rather slow temperature dependence of the peak is represented by
![]()
![]()
Values of ![]() are given in table 21, the conversion
to pressure being obtained from the equation of state.
are given in table 21, the conversion
to pressure being obtained from the equation of state.
![]()
Figure 4. The density dependence of the maxon peak. Triangle, Cowley, and Woods [2]; circles, Graf et al. [6]; solid line, eq (4).
|