

(new graph)
North = 12%
South = 34%
East = 15%
West = 39%
The east and west orientations contribute 54% of the total daily gains while representing only 7 of 18 window bays. These numbers again support the hypothesis that the east and west orientations are less effective at excluding solar gains.
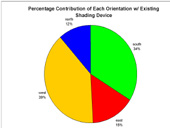
Percentage contribution of each orientation with existing shading device