


Russell J. Donnelly
541-346-4226 (Tel)
541-346-5861 (Fax)
![]()
| <<Previous | Page1 | Page2 | Page3 | Page4 | Page5 | Page6 | Page7 | Next>> |
![]() Table
1 : : 2 : : 3
: : 4 : : 5
Table
1 : : 2 : : 3
: : 4 : : 5
Saturated Vapor Pressure
![]() The
Calculated Thermodynamic Properties of Superfluid Helium-4
The
Calculated Thermodynamic Properties of Superfluid Helium-4
![]() James S. Brooks and Russell J. Donnelly
James S. Brooks and Russell J. Donnelly
4.3.c. The Gibbs Free Energy
The
Gibbs free energy ![]() has
a ground state Part
has
a ground state Part ![]() o
(P) and an excitation part
o
(P) and an excitation part ![]() E(P, T)
given by the double integral in table I.
E(P, T)
given by the double integral in table I. ![]() o(P) can be determined by integrating
the expression d
o(P) can be determined by integrating
the expression d![]() = VdP.. The results determine
= VdP.. The results determine ![]() o
at T =0 K to within an additive constant Lo as described in section 4.3.b. above.
o
at T =0 K to within an additive constant Lo as described in section 4.3.b. above.
![]()
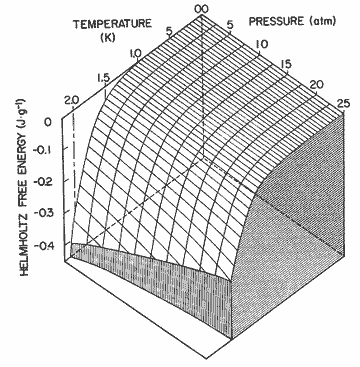
Figure
13. The Helmholtz free energy of the excitations as a function of pressure
and temperature. The Gibbs free energy has substantially the same appearance.
| Table
V. The ground state Gibbs free energy |
||||||
| P(atm) | 0 | 2.5 | 2 | 7.5 | 10 | 12.5 |
| 0 | 1.7205 | 3.3972 | 5.0373 | 6.6457 | 8.2263 | |
| P(atm) | 15 | 17.5 | 20 | 22.5 | 25 | |
| 9.7821 | 11.316 | 12.829 | 14.323 | 15.800 | ||
The
Gibbs free energy is not directly accessible experimentally. The data
of table V come from integration of the equation of state of Abraham et
al. [31] and hence should be reliable. The excitation part of the Gibbs
free energy is tabulated in table 7: the appearance of this energy surface
is similar to the Helmholtz energy in figure 13. We have checked the integration
by comparing to ( ![]()
![]() /
/
![]() T )p to S. The
differences are less than 0.3% over most of the T-P plane and
never exceed 1%.
T )p to S. The
differences are less than 0.3% over most of the T-P plane and
never exceed 1%.
4.3.d. The Enthalpy
The
enthalpy W has a ground state part Wo (P) and an excitation
part WE (P,
T) as given by the double integral in table I. The ground state
part Wo (P) = ![]() o(P)
is tabulated in table V in section 4.3.c. above. The enthalpy of the excitations
is tabulated in table 8 and illustrated in figure 14.
o(P)
is tabulated in table V in section 4.3.c. above. The enthalpy of the excitations
is tabulated in table 8 and illustrated in figure 14.
We have cross-checked our tabulations with the equivalent expression ![]() .
We find the differences are less than 1.7% at most temperatures and pressures.
The enthalpy, then, should have the same basic accuracy as the specific
heat, as discussed in section 4.3.e below.
.
We find the differences are less than 1.7% at most temperatures and pressures.
The enthalpy, then, should have the same basic accuracy as the specific
heat, as discussed in section 4.3.e below.
4.3.e. The Specific Heat
The
specific heat at constant pressure,
![]()
![]()
is
obtained by the integral expression in table I. Below 1 K this worked
satisfactorily; above 1 K we experienced difficulty in getting a smooth
table. We therefore used (29) directly, selecting five local entropy values,
fitting a quadratic function by least squares, and finding ![]() from that function. The resulting values are listed in table 10 and plotted
in figure 15.
from that function. The resulting values are listed in table 10 and plotted
in figure 15.
The deviations ![]() CP
= (CP
calc - CP
meas) CP
meas have been compared with the data of Wiebes [36]
for T
CP
= (CP
calc - CP
meas) CP
meas have been compared with the data of Wiebes [36]
for T ![]() 1.6 K.
1.6 K.
P(atm) |
0 |
5 |
10 |
15 |
20 |
25 |
| 2.2 | 1.5 | 1.4 | 0.88 | 1.0 | 2.0 | |
| 6.5 | 3.0 | 2.2 | 2.3 | 3.3 | 2.8 |
The ratio of specific heats is compiled from
![]()
![]()
The
term in ![]() is subject
to an accumulation of errors and is perhaps as much as 50% in error in
some regions. Values of ? are tabulated in table 12.
is subject
to an accumulation of errors and is perhaps as much as 50% in error in
some regions. Values of ? are tabulated in table 12.
![]()
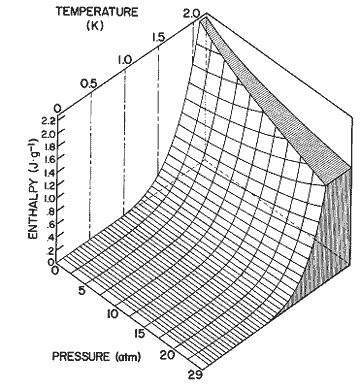
Figure 14. The enthalpy of the excitations as a function and pressure and temperature, as calculated from the expression in table I.
The
specific heat at constant volume CV
= CP / is listed in table 11. Although is quite uncertain, the
correction is generally small. Comparing with the data of Wiebes [36],
we find the deviations are as follows (T ![]() 1.6 K):
1.6 K):
P(atm) |
0 |
5 |
10 |
15 |
20 |
25 |
| 2.2 | 1.6 | 1.4 | 1.0 | 2.2 | 2.7 | |
| 6.5 | 2.9 | 2.1 | 2.3 | 3.2 | 2.6 |
Table I shows an integral expression for CV . We have used the correction of eq (30) rather than our theoretical expression because the latter involves a derivative at constant volume.
![]()
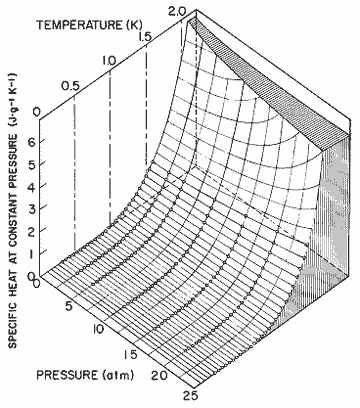
Figure 15. The specific heat at constant pressure as a function of pressure and temperature, calculated from the expression in table I. Data, Wiebes, [36].
4.4.
Superfluid Properties
4.4.a. The Excitation Number Densities
The density of thermal excitations,
calculated by numerical integration, has been separated into a phonon
part NP and a roton part Nr by defining (quite arbitrarily) excitations
with wave number less than 1.1 Å-1 phonons. For phonons, we have
for the number density [from eq (1)]
![]()
![]()
and for rotons
![]()
![]()
where qmax=1.1 Å-1 qf =3.0 Å-1. Tabulations of Np and Nr appear in tables 13 and 14, respectively. No comparison of the results can be made since the number densities are not directly accessible experimentally.
4.4.b. The Normal Fluid and Superfluid Densities
The normal fluid density may be computed from Landau's expression
![]()
![]()
and
the computed values appear in table 15. From the equation of state, we
may obtain the superfluid density by subtraction of ![]() ,
,
![]() ps
= p - pn,
ps
= p - pn,
and
one may also obtain the ratios pn/p and
ps/p. The quantities pn/p, ps,
and ps/p appear in tables 16, 17, and 18
respectively, and pn/p is
plotted in figure 16.
The calculations can be compared with a variety of experiments. At the
vapor pressure, the deviations ![]() pn
= (pn cale - pn meas)/(pn meas)from the
data of Tough et al. [44] are
pn
= (pn cale - pn meas)/(pn meas)from the
data of Tough et al. [44] are ![]() , with most of the latter
error occurring at 2 K and above. Comparing with some unpublished data
of Maynard (based on second and fourth sound measurements [21]), one finds
the following:
, with most of the latter
error occurring at 2 K and above. Comparing with some unpublished data
of Maynard (based on second and fourth sound measurements [21]), one finds
the following:
P(atm) |
0 |
5 |
10 |
15 |
20 |
25 |
| 3.1 | 2.7 | 2.5 | 3.8 | 3.6 | 8.0 | |
| 0 | 2.8 | 4.0 | 3.5 | 5.8 | 5.0 |
The oscillating disk data of Romer and Duffy [45], principally above 1.6 K, averages about 4-7% low compared to our calculations.
4.4.c. The Velocity of Second Sound
The velocity of second sound, neglecting thermal expansion, is
![]()
![]()
where
uII was used to correct
the velocity of first sound in section 4.2.a above. Allowing for thermal
expansion the velocity of second sound is given by [40, 41].
![]()
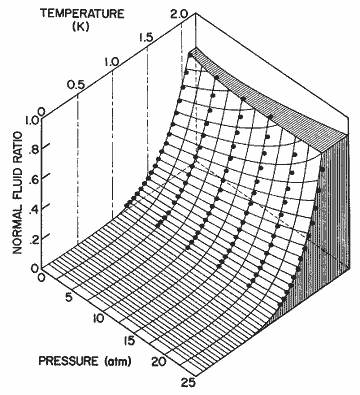
Figure 16. The normal fluid fraction as a function of temperature for different pressures calculated from eq (33). The data points are from Maynard [21].
![]()
![]()
We have used equation (34) to compute u2, with results given in table 19 and figure 17. The data shown in figure 17 is that of Heiserman et al. [21]. Comparison of our results with the data of [21] is as follows:
P(atm) |
0 |
5 |
10 |
15 |
20 |
25 |
| 0 | 0.5 | 0.1 | 0.6 | 0.9 | 0.8 | |
| 2.1 | 1.7 | 2.4 | 4.6 | 4.2 | 4.8 |
Below 0.8 K, the calculated values show marked effects of phonon dispersion, as discussed by Brooks and Donnelly [30].
![]()
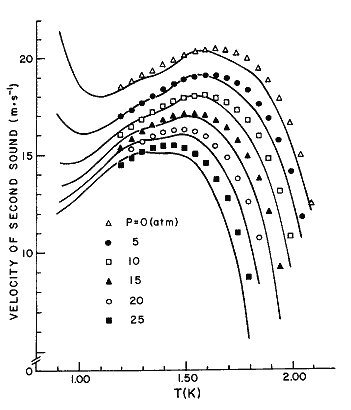
Figure 17. The velocity of second sound as a function of temperature, at different pressures. Solid lines, eq (34); data points, from Heiserman et al. [21]. Some of the unevenness of the calculated curves may be the result of numerical problems; note how many derived quantities appear in eq (34).
4.4.d. The Velocity of Fourth Sound
The velocity of fourth sound is, to good approximation [40, 41]
![]()
![]()
We have used equation (35) to compute u4, with results given in table 20 and figure 18. The deviations, compared with the data of Heiserman et al. [21] are:
P(atm) |
0 |
5 |
10 |
15 |
20 |
25 |
| 0.3 | 0.5 | 0.9 | 6.4 | 1.5 | 1.4 | |
| 0.4 | 5.3 | 6.4 | 0.2 | 0.5 | 2.4 |
5. Conclusions
We
have provided tables of the thermodynamic and superfluid properties of
helium II computed, when possible, by theoretical methods. Due to inadequacies
in the present theory, we were not able to achieve absolute agreement
with the experimental data in all cases. The accuracy of our computed
values is, however, generally very good, and we hope that the tables will
provide a ready reference for theoretical and experimental research in
helium II .
Perhaps the most interesting outcome of this research, other than the
tables, is the result that there appears to be no theory at present which
can accurately relate the energy and momentum of the elementary excitations
of helium II, as measured by inelastic neutron scattering, to the thermodynamic
properties. The problem may be in part the assumption of zero line width
for the spectrum, but other considerations such as the time scale of the
neutron probe, and the re-establishment of equilibrium after an excitation
is created, may prove important factors. These tables provide a unique
opportunity for comparison of the spectrum measured by neutron scattering,
and the spectrum which yields the correct thermodynamic properties via
the Landau theory, and it is hoped that our analysis will stimulate theoretical
interest in this problem.
On the experimental side, we see that there are serious gaps and discrepancies
in some of the data which have been considered established for many years.
Even the equation of state would benefit from a systematic study over
the entire (T, P) plane. An ideal experiment would
simultaneously measure the velocities of first, second, and fourth sounds,
and the expansion coefficient in one cryostat over all pressures and all
temperatures from 0.3 K upward. When such data are available, the present
study could be repeated with considerable profit.
![]()
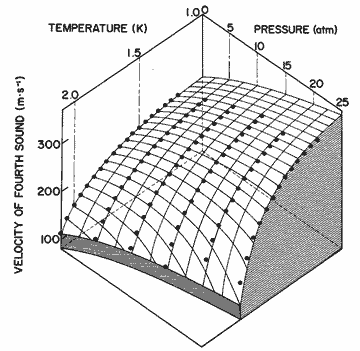
Figure 18. The velocity of fourth sound as a function of pressure and temperature calculated from eq (35). The data points are from Heiserman et al. [21].
6. Acknowledgments
This research was supported by the Air Force Office of Scientific Research under grant AFOSR-76-2880 and by the National Science Foundation under grant DMR-72-3221/A01. This work was begun when the authors were guests at the Niels Bohr Institute, Copenhagen, and we thank Professor Aage Bohr for the hospitality of the Institute. We would also like to thank Mr. James Gibbons for much help in the preparation of the computer results for our initial report, and for the entire task of preparing the present tables using recent data and the formulae of table I. We are indebted to Professors D. L. Goodstein, R. P. Feynman, R. M. Mazo, and P. H. Roberts for discussions and collaboration on the theory. Professor I. Rudnick, Dr. Jay Maynard, and Dr. C. Van Degrift have made data available to us in advance of publication. We have appreciated the support and patience of the editors and staff of this Journal in the preparation of the manuscript.
|

