|
|
|
|
|
Data & Analysis
|
|
|
|
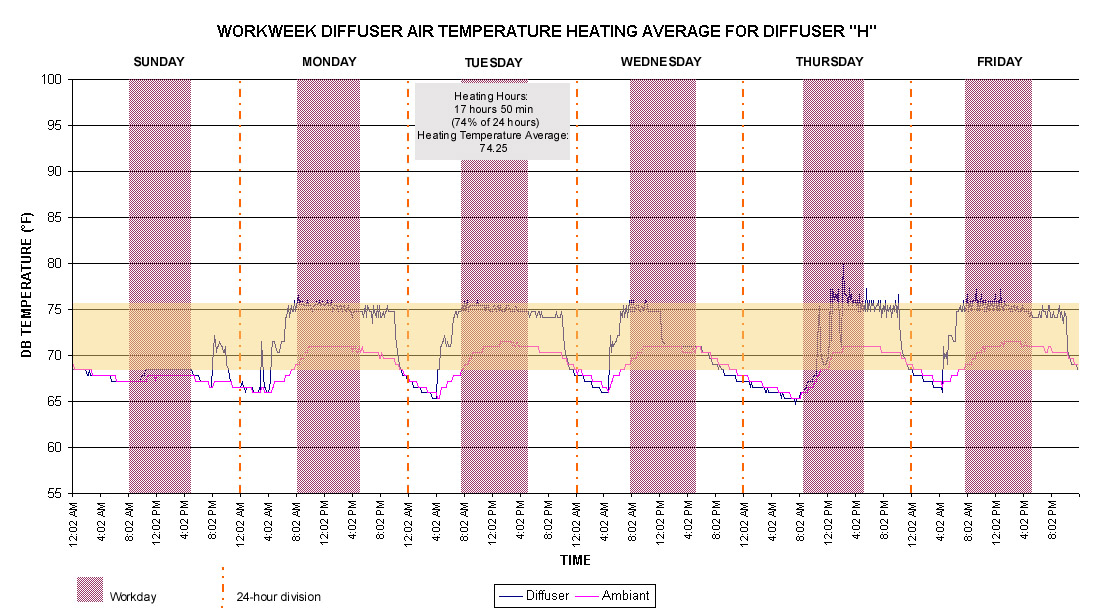
The following graphs illustrate data collected from HOBOs placed at the Ecotrust Office at the 2nd floor and the CFPC Office at the 3rd floor. A typical workweek was analyzed for determining the percentage of time over a 24 hour period that the HVAC system spent heating, in conjunction with the heating average temperature. The graphs focus on Tuesday, February 26, 2002 as a representative weekday for HVAC activity and represent both perimeter and interior conditions for each office space studied. |
|
|
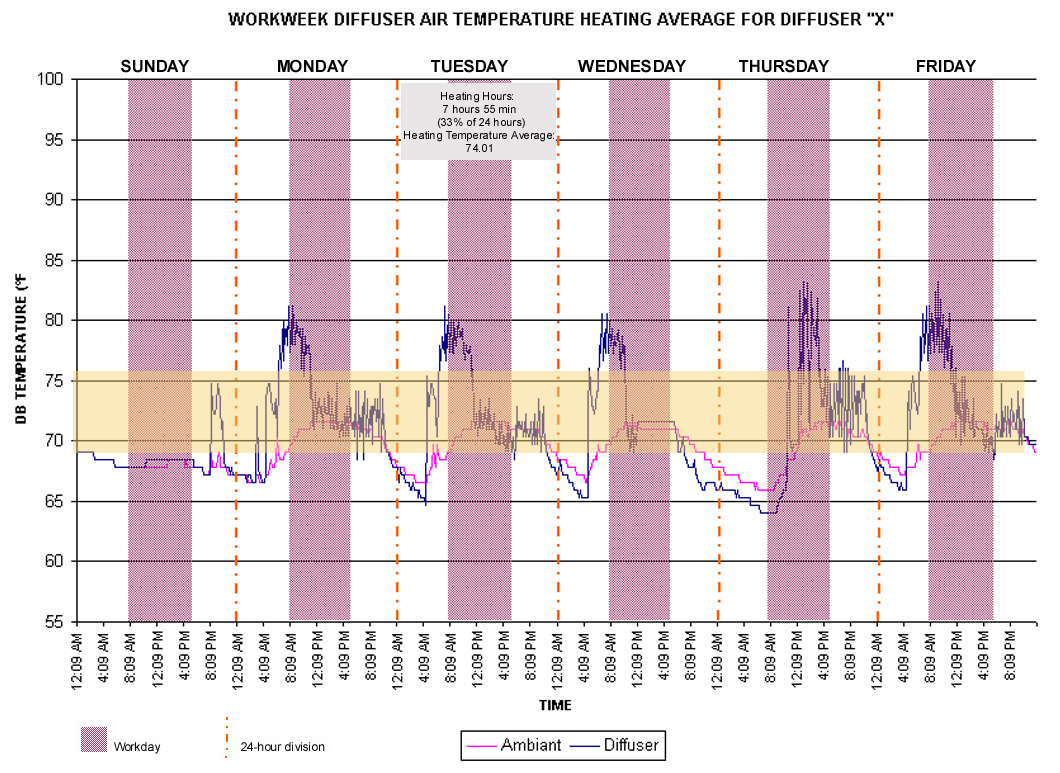
| This data proves the hypothesis to be partially correct. The system engages in heating more often in the Ecotrust Office, proving the portion of the hypothesis that states the HVAC heats more often at the second floor space to be correct. However, the predicition that the HVAC on the second floor heats at higher temperatures than the third floor was incorrect. The third floor average temperatures released from the diffusers are higher than those of the second floor. |
|
|
| The longer percentage of time (in a 24 hour period) that the HVAC system was heating the Ecotrust Office may be a result of the sheer volume of the space due to the higher ceilings. Because there is such a large volume of air to condition, it takes a longer period of time before the thermostats register the set ambient temperature. |
|
|
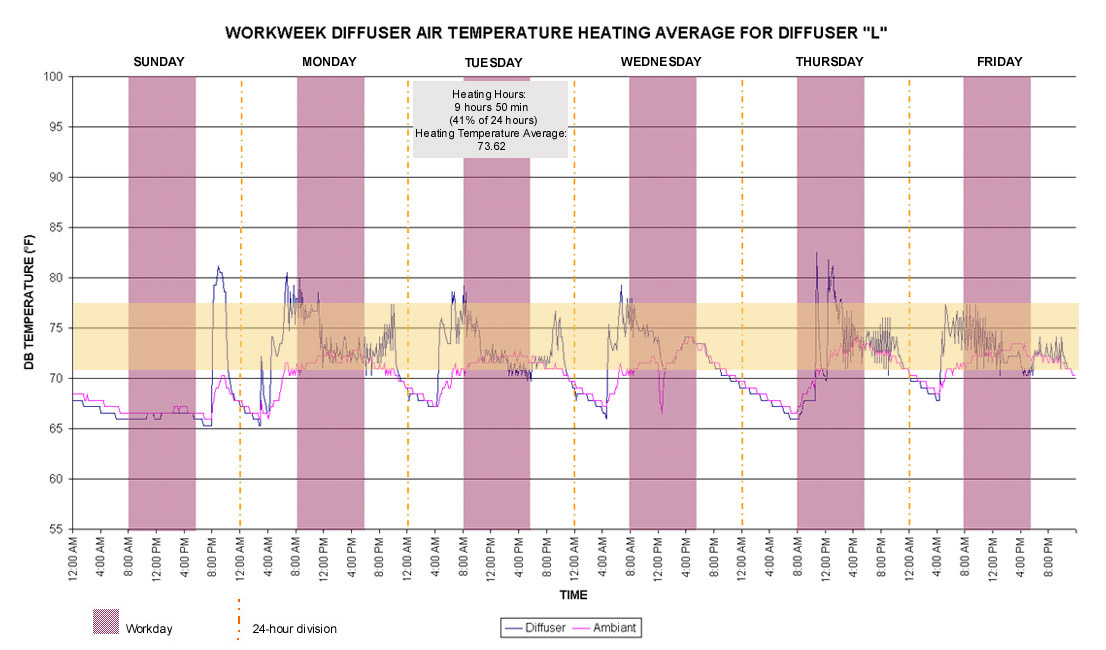
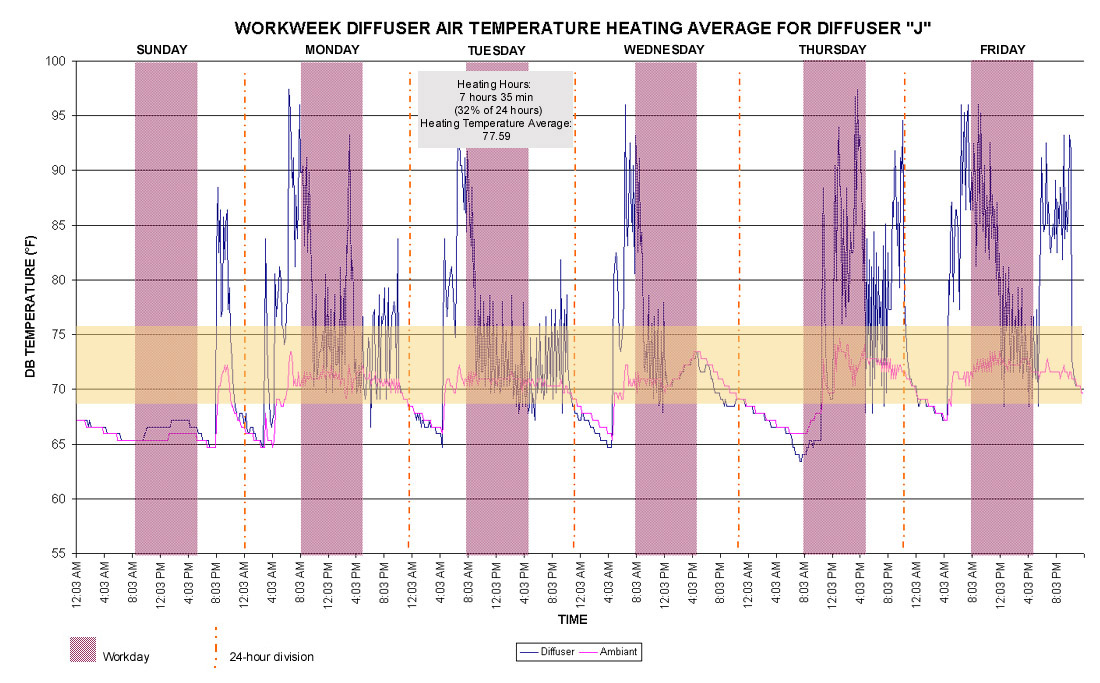
| The fact that the third floor diffusers are less active in heating but must work at higher temperatures shows that heat is being lost through the envelope despite insulation and energy-efficient windows. It appears that the Ecotrust office is indeed being thermally protected by the third floor addition. The third floor allows more rapid heat loss, requiring higher heating temperatures to maintain desired indoor ambient air temperature. |
|
|
|
|
|
|
|
 |
|
|
|
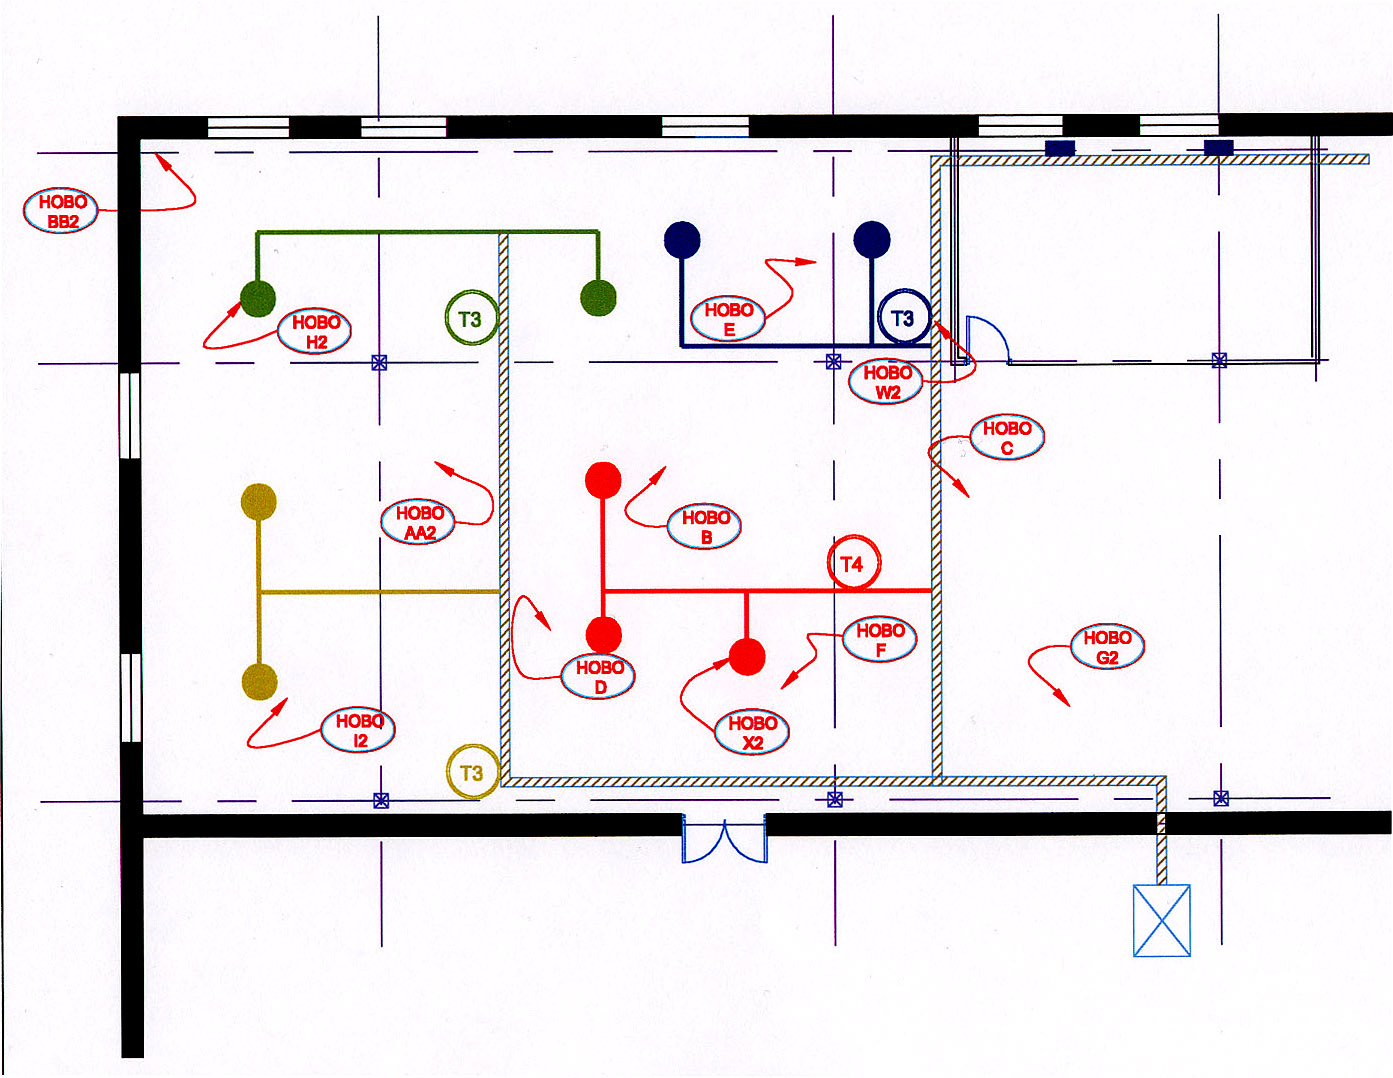
ECOTRUST OFFICE, SECOND FLOOR |
|
|
|
 |
|
|
|
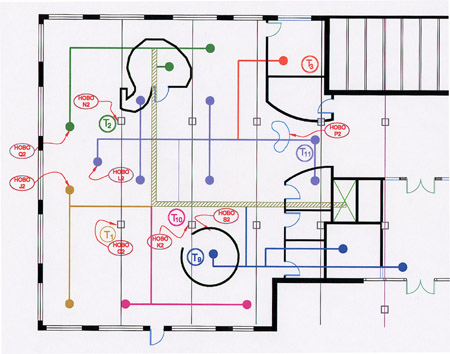
CFPC OFFICE, THIRD FLOOR |
|
|
|
 |
|
|
|
CFPC OFFICE, THIRD FLOOR |
|
|
|
 |
|
|
|
|
|
|
|
|
|
|
|
|
|
|
|
|
|
|
|
|
|
|
|
