
Site visit 2, Thursday, January 30th, 2003:
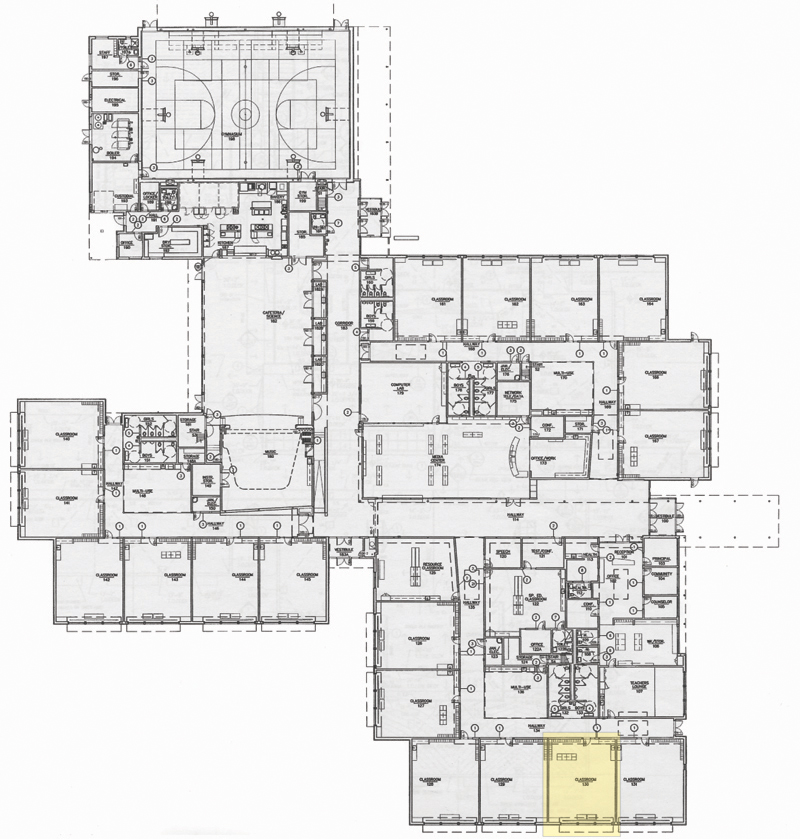
- We chose a South-facing classroom and plotted nine points at which to take measurements and floor, desk, and eye level
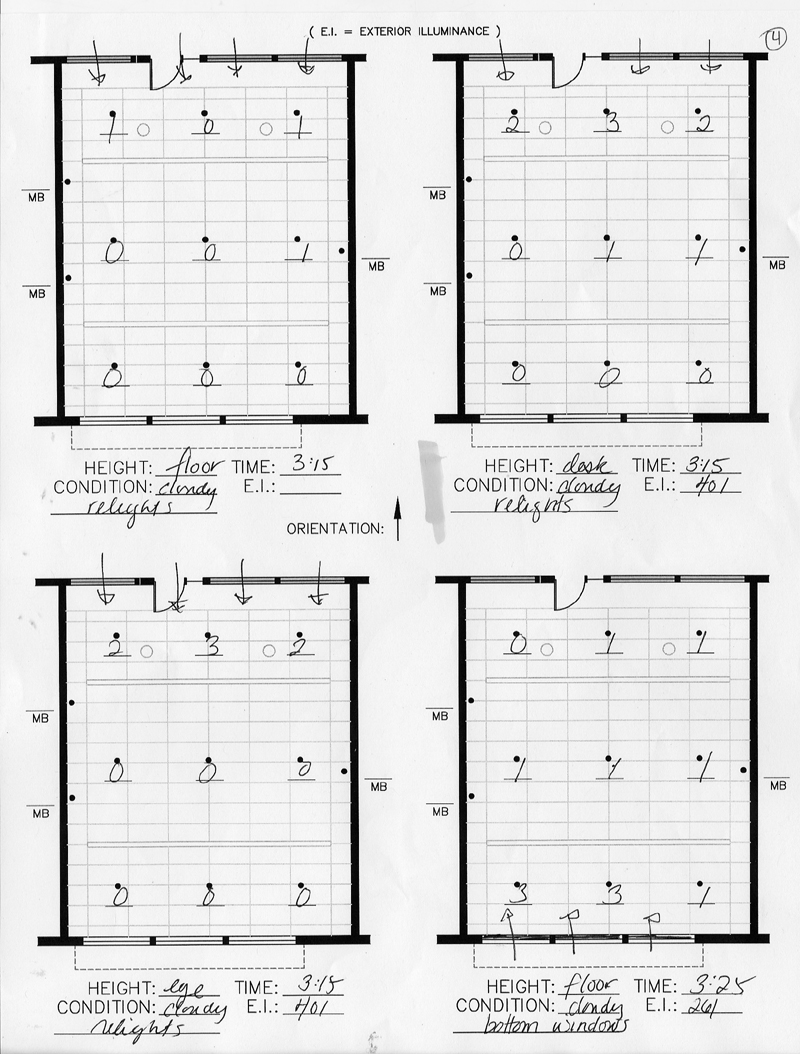
- Measurements taken with all lighting sources as well as each individual light source
On Thursday January 30th we made our second visit to Ash Creek. Our goal was to make a thorough illuminance survey of one classroom, isolating the contribution of each of the several light sources to the total illuminance levels throughout the room. On the day of our second visit the weather was overcast and raining intermittently, which provided an excellent opportunity to study daylighting in the most adverse situation in terms of adequate illuminance levels.
We marked out a grid of nine evenly spaced points on the floor of the classroom from near the windows to the opposite side, near the windows. We positioned a Sylvania light meter on the sill outside the window so that we could record exterior illuminance to provide a point of comparison for our interior readings. We recorded outside illuminance for every set of interior data.
The first set of readings measured illuminance levels in the class room with all sources of daylight contributing. Measurements of illuminance of the horizontal plane were taken at each of nine points at floor, desk and eye level. We used Sylvania light meters, holding them flat and taking care to hold them away from us so as not to block light. We took a second set of readings with one of the banks of fluorescent lights on and all daylighting strategies in effect. This was the typical condition that the automatic lighting controls selected for the darkest daytime hours.
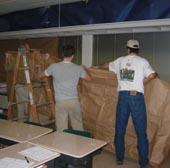
The next step was to isolate the various sources of daylight. We blocked the windows, interior re-lites, and the solatubes with opaque paper. Once all sources were blocked and the electric lights were turned off we checked illuminance levels. We didn’t achieve absolute darkness but confirmed with the light meters that illuminance levels were less than 1 fc, i.e. lower than the precision of our readings, which was estimated at ±5 or more footcandles based on the fluctuation of the light meters. We took a set of readings first with only the solatubes uncovered, then with only the hallway re-lites uncovered, then the exterior windows uncovered. When collecting data for the illumination contribution of the exterior windows, we took two sets of data, one with only the portion of the windows above the light shelf uncovered, then with the entire window uncovered.