|
|
|
Methods
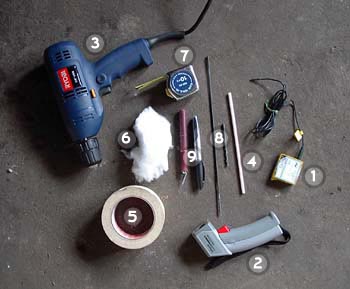
Equipment List
 |
 |
- 7 HOBO
Data loggers with external temperature sensors (6 foot
cord)
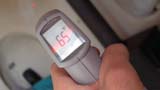
- Raytek Infrared
Thermometer
- Drill and drill bits
- Plastic drinking straws (about 8" long - 1/4"
diameter)
- Masking tape and duct tape
- Cotton batting
- Measuring tape
- Permanent marker
- Utility knife
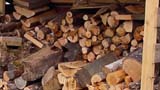
- Wood for 12 hour woodstove firing (not pictured)
|
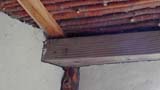
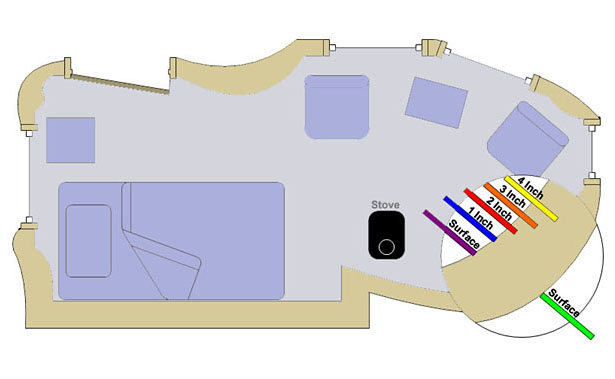
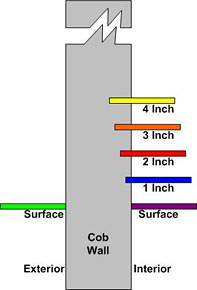
Data Logger Placement
We placed 5 data logger temperature sensors on and at various depths inside the interior north wall of the building. All these were located about 4 feet from the wood stove, our main heat source. The sensors were placed at the following depth levels:
- Interior Surface
- 1" depth
- 2" depth
- 3" depth
- 4" depth
An additional data logger was placed on the surface of the north
wall. The location was directly opposite interior hobos.
Rationale and Process
We chose the north wall of the structure for the hobo placement
for two reasons: (a) The north wall does not get solar radiation
and (b) it is in close proximity to the wood burning stove - the
main heat source. We placed the data logger temperature sensors
at various depths in the wall to track the heat movement through
the wall.
The following is a step-by-step outline of our data gathering process.
- Baseline
The cob building was left unheated for an extended period
so the temperature of the walls, indoor and outdoor temperatures
were close to equal.
- Launching data loggers
We launched the data loggers to collect temperature readings from
the temperature sensors every 10 minutes.
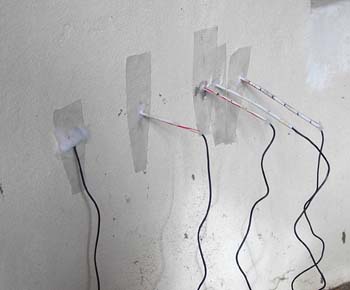
- Preparing the sensors
To achieve rigidity and to reduce air infiltration, we split the
plastic straws lengthwise with the utility knife, inserted the
temperature sensors and cotton batting, and taped the straw closed.
The tip of the temperature sensor aligned with the tip of the
straw. This increased rigidity allowed for easier temperature
sensor placement, and the batting provided insulation to reduce
air infiltration.
- Installing the indoor sensors
We then drilled holes in the cob wall and inserted the straws/temperature
sensors to the correct depths. The holes were drilled to have
as small diameter as possible to reduce air infiltration.
- Reducing air infiltration
To further reduce air infiltration, we inserted additional cotton
batting around the base of the straw and taped the straw and batting
in place using duct tape.
- Installing outdoor sensor
The outdoor surface temperature sensor was taped in place under
a patch of cotton batting.
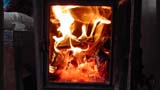
- Heating period
After waiting for a short period to establish a base line, we
started the fire in the woodstove. The fire was kept burning for
12 hours, and then allowed to die out. We ensured that the space
was not reheated before retrieving the data loggers (one of us
stayed overnight, and we put up signs for the following day).
- 54 hour data collection period
The data loggers were kept in place and collected data for a total
of 54 hours.
- Collecting data
After the test period, we transferred the data collected by the
data loggers to a PC using the HOBO Boxcar software.
- Charts
We used Microsoft Excel (spreadsheet software) to create charts
to help us with the interpretation of the data.
|