Academic Year 2002-2003
Treatment Study
Introduction: The Hendricks Park Secondary Invasive Plant Management Study is designed to evaluate the effectiveness of 4 different management protocols for controlling the spread of Herb Robert and Nipplewort. There are 124 plots in the study. Each is 1.5 meters wide and 1.5 meters long. Each of the 4 treatments - hand pulling, mulching, burning, mulching and burning ö and the control are replicated 25 times and are randomly distributed. The data below shows initial results of early stem counts.
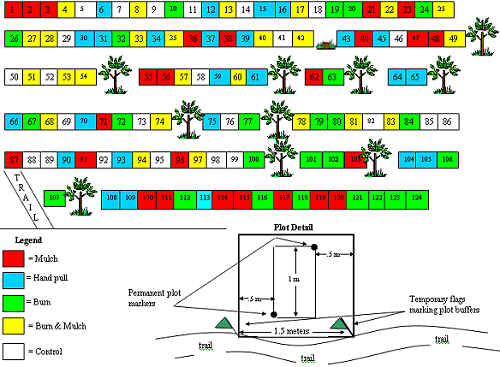
Plot dimensions ö Each plot is 1 meter long by .5 meters wide. Diagonal corners of the plot are permanently marked with a metal nail and washer pounded into the ground. Plots are nested inside a buffer area. See illustration at bottom of treatment map.
Edge Plot Treatment Map ö Two sites were chosen in the park where Herb Robert and Nipplewort are present, a 25 plot section alongside a closed road within the park's forested area and 99 plots along a nearby intersecting trail. The map below illustrates the four treatment methods applied to the monitoring plots and it will be used as reference for future plot work.
Data Collection ö After six weeks the treatment plots were visited by the project group to collect initial stem counts. The graph and tables 1 and 2 below illustrate our preliminary results and provide some interesting statistics. Further treatments and stem counts will hopefully provide enough quantitative data to provide park staff with the information needed to make appropriate management decisions.
|
||||||||||||||||||||||||||||||||||||||||||||||||||||||||
|
||||||||||||||||||||||||||||||||||||||||||||||||||||||||
Native Plant Growth ö Another consideration for treatment effectiveness is the success of native plant growth. Native plants within the boundary of the treatment plots are estimated using a cover class scale. Native plants with stems rooting from the buffered zone are ignored. Cover class is scaled in percentage of plot cover as seen looking from above. Cover class scale: 0 = 0%; 1 = 1 - 5%; 2 = 6 - 20%; 3 = 21 - 50%; 4 = 51 - 75%; 5 = 76 - 100%
Table 3 below shows the native cover class statistics from the first data collection.
|
Table 3: Native Cover Class |
||||||||||
|
Number of plots in each cover class |
||||||||||
| Num Plots | Avg | Max | Min | 0 | 1 | 2 | 3 | 4 | 5 | |
| Mulch | 25 | 1.0 | 3 | 0 | 7 | 13 | 3 | 2 | 0 | 0 |
| Hand-pull | 25 | 1.4 | 4 | 0 | 3 | 14 | 4 | 2 | 2 | 0 |
| Burn Only | 25 | 0.7 | 1 | 0 | 7 | 18 | 0 | 0 | 0 | 0 |
| Burn & Mulch | 25 | 0.6 | 1 | 0 | 11 | 14 | 0 | 0 | 0 | 0 |
| Control | 24 | 1.1 | 3 | 0 | 3 | 17 | 3 | 1 | 0 | 0 |
![]() Issues at Hendricks Park
Issues at Hendricks Park
![]() Project Objectives
Project Objectives
![]() Project Task List
Project Task List
Project Development
![]() Educational Plant
Guide
Educational Plant
Guide
![]() Invasive Species Monitoring
Invasive Species Monitoring
![]() Treatment Study
Treatment Study
![]() Encroachment Study
Encroachment Study
![]() Forest Inventory
Update
Forest Inventory
Update
![]() Plot Photo
Database
Plot Photo
Database
![]() Data Analysis
Data Analysis
![]() Misc. Project
Photos
Misc. Project
Photos
![]() Reference Sites
Reference Sites
Fall Term Presentation
Winter Term Presentation
Final Presentation
![]() Online MS PowerPoint presentations work best with
Internet Explorer 4.0 or newer.
Online MS PowerPoint presentations work best with
Internet Explorer 4.0 or newer.