
Lecture Plan
I. Introduction to Methodology
This unit teaches about important aspects of how behavioral observation data
are structured for analysis. It deals with one simple idea, patterning, but it requires
thinking about the methods involved. "Patterns" are repetitions of events in time.
There are two ways of talking about repetitions in time:
(a) the total number of events per unit of time, or base rate, and
(b) the specific sequence of lead-follow units (e.g., Stimulus
Response events, SR units as they occurred over time.For example: How many times do you touch your face in 10 minutes?
(Total number of face touches.)
How many of those face-touch times occur when I call on you?
Now the unit is--
[ Stimulus: Calls on; Response: Face Touches]If I know your touch rate is 4 times per minute, whether or not I call on you,Possibilities: all of them occur ONLY when I call you, 100%, or
I can also ask whether you touch more or less (than EXPECTED), given
that I called on you. In terms of probability:we would determine that your rate of face touches is, say .25. (If I secretly
looked in on you, you are likely to touch your face 25% of the time.)
That is your base rate of face touches. It is also the unconditional probabilty
(it just happens, it is not conditional upon somehting else having happened first).
Now I can also calculate how many of those face touches happened when
I call on you.
50% occur when I call on you.
3% occur, and so on, all the way to 0% occur when
I call on you.So you see, the pattern [calls on -- face touches] may
be more or less likely than just knowing you are a 25% face-toucher.
But don't be confused: your total face-touch "pie" is still 25%.
We are only asking whether the events represented by the 25% of
the time occur more than expected ( i.e, just 25%) when something
else has just happened.That is, the conditional probabilit is that probability of some event,
given some other prior (conditional) event.For example, H+ given W- is NOT the same as the unconditional
probability of H+. He may be "more"likely to be positive when she is
negative than we expected, i.e., more positive than just knowing his
base rate of being positive (H+).
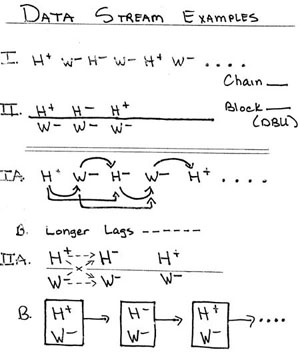
II. Understanding methods for describing patterns of interactionsData stream = the actual depiction of the events according to the code-book.
Base rates = the observed rate at which something happens over time,
as in total events divided by total timeE.g., 33 positives in 10 minutes = 33/10 = 3.3 per minute
Sequential analysis = method for describing unfolding patterns
Retains the sequence (or order) of events, i.e., which
came first, etc.E.g., H+ W- H- W- H+ W- W+ ..................
Example: Base rates (from this sequence):
2 H+, 1 H-, 1 W+, 3 W- (in x minutes)Sequential analysis (Lag-1):
| Response |
| Stimulus:: | H+ | H- | W+ | W- | Total | |
| H+ | 2 | 2 | ||||
| H- | 1 | 1 | 2 | |||
| W+ | (1)* | |||||
| W- | 1 | 1 | 1 | 3 |
Explanation:
Now think back to the Systems
pictureI showed you of M,F,C in Section I.
We said that by looking at the frequency with which various
combinations
occurred we could tell something about the family.
This is especially true here too. Let's say that for the
PATTERN H+ W-
there were 10 counts of this event sequence in the chain:
what would
you say about this couple? (Husband does something positive
followed
immediately by wife doing something negative.)
What if I made the window size 2, or 3 etc.? What would
you say
if the H+W- pattern occurred 10 times when viewed through
a
window as large as 4? That means that after each H+ we
get a
W- only after three other responses intervened,
H+ [ 1, 2, 3] W-
. What would you make of the timing of this pattern for
the couple?

There are two forms of reciprocity that we need to be concerned with:
Base Rate and Sequential or Serial reciprocity
Base rate always refers here to the total output
of some behavior,
regardless of order effects. All the "smiles" a person
emits in a period
of time is what we refer to as his/her "base rate of
smiles"
Base rates, in one sense, serve to describe a "personality"
of an
interaction. If we know that H has a base rate of smiles
that is .45,
and W has a rate of .68, we could say that this couples
puts out a
combined total of more than 50% of smiling behavior (i.e.,
~.5
of all their behavior coded in fixed time will be smiles).
This is
a happy couple!
Base rate reciprocity
We can define the likelihood (or probability) that any
given observed
behavior will be of type X (e.g., smiles) by simply using
X divided by
all behavior, as above. The only new idea here is that
p
(the
probability)
can be used just like a score. If each spouse
has a p value for their
own version of behavior X, we have two p
values or scores. Now,
over couples, we can compute the correlation (r)
between these p
values, one for H and one for W as:
p(H-) or p(W-) Husband negative, or
Wife negative
Sequential or serial reciprocity
Conditional probability forms the basis for the scores
for each
spouse. Conditional probability refers simply to a
limitation of
events, such that a final event is dependent upon
(or conditional
upon) something else having been true. This is neat for
marriage
work because we actually want to see whether one person's
behavior
is dependent upon the other's behavior! We can do this
simply
using the notion of conditional probabilities. Just as
we defined
a score above as p(H+) we can also define a conditional
score which says the probability of H+ given W+ is
such
and such a number. The higher this number the more likely
it
is that H will be + WHEN W is also +. Remember,
H can be +
whenever he wants (limited by his own base rate of H+),
but
if he makes his H+s only when W is (or has been) +, then
clearly he is dependent on her behavior. Conditional
probabilities
are written according to the following codes:
p(H+ | W+) or (W-| H-)
The vertical line stands for "given". You would read these
as "Husband
positive given wife positive", etc. What we would like
to know is
whether the husband's behavior is really tied to his
wife's behavior,
as in the notations in the following examples
p(H+ | W+) > p( H+) or p(H- | W-)>( H-)
Now putting this together with reciprocity we can say
that two
sets of behavior patterns are reciprocal
(or linked) if there is a
high correlation between spouses on these very patterns,
or
p(H- | W-) . p(W- | H-)
Negative Affect Reciprocity within Person:
Discussion Topic :
Sex
| Fun | H+ | H- | W+ | W- | |
| H+ | 27 | ||||
| H- | 36 | -22 | 23 | ||
| W+ | |||||
| W- | 29 | -32 | 34 |
Same study below, (two occasions) but now the rs
are between the sequential
patterns discussed above. Here the force of negative
affect reciprocity is very clear
The rs tell us that a pattern of (say) wife negative
given husband negative during
the time 1 discussion is reciprocated in the time 2 discussion
(r = .39). But even
more striking are the H-|W- W-|H- (r = .62) and the W-|H-
H-|W- (r = .54)
reciprocal patterns. These indicate that regardless of
who starts being negative
the other person is more likely to be negative. [These
data are from as study
reported by Gottman , 1980, and are used here to illustrate
the methodology.]
| Fun | W+|H+ | W-|H- | H+|W+ | H-|W- | |
| W+|H+ | |||||
| W-|H- | 39 | 62 | |||
| H+|W+ | |||||
| H-|W- | 54 | 46 |
III. Coding IllustrationsA. Coding Options -- different ways of portraying methods for observing
interaction data
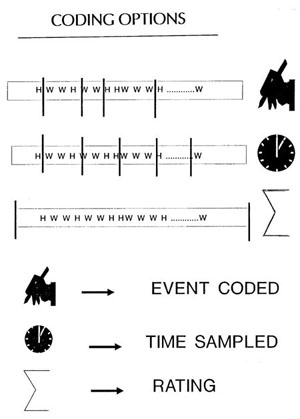
B. Data Stream -- options for clustering data (i.e., discrete code, sequences)
C. Examples of cumulative point graphsThese show the trend within a discussion,whether increasingly positive
(regulated) or increasingly negative (non regulated). Using the trend
(point graphs) as a predictor we can then decide whether wehave types
of couples (i.e., satisfied or divorce prone, etc.). Positive and negative
codes are assigned numerical weights, and the algebraic sum of the
weights are plotted for every talk turn. E.g., +5 -3 +2-1 = +3. If the
discussion gets more and positive (i.e., +'s outnumber -'s) the trend
is upward; scores are added to the immediately previous score
(= cumulative points).
Behavioral Observation
| Return to Main |