Repeated Measures ANCOVA
I. Why?
To reduce the error variance in experimental designs by accounting for
individual differences in responses.
A. Covariates
stable over trials. Although random
assignment of subjects to conditions theoretically eliminates the possibility
of confounding between experimental manipulations and subject characteristics,
these individual differences (e.g., IQ, emotional sensitivity) may still affect
the subjects’ performance and obscure effects that are present. Hence, experimenters may measure these
characteristics and take them into account in analyses of the data.
B. Covariates
changing over trials. Subjects may
differ in their responses to treatments in ways that can be measured and taken
into account in analyses. For example,
a researcher investigating the effects of emotion on cognitive processes may
induce different emotional states.
Because subjects differ in their susceptibility to these inductions, the
subjects’ emotional responses may be measured and covaried in analyses of the
measures of cognitive processing.
II.
How? Different approaches. The linear model approach is described here.
A. Perform a
regression treating each observation on each subject as a separate case.
1.
Subjects as factors: Each data point can be
regarded as a function of the factors including subjects that are used in the
analysis. Therefore, subjects could be
entered into the model as a factor or as n-1 dummy variables..
2.
Criterion scaling: In most real problems there
are too many subjects to create n-1 dummy variables. Analyses with this many variables will exceed the capacity of
many statistical programs. Fortunately,
there is an alternative. Recall that the sums of squares due to subjects
represents how the means across conditions for each subject vary around the
grand mean. One can take into account
the variation due to subjects by creating a variable that is equal to the
subject mean on the dependent measure across within-subjects levels. One may then proceed with the analyses, entering
this new variable in place of the subject variables.
B. Example without covariate (Winer p. 268; see
repeated measures handout)
Drug
Person
Person 1 2 3 4 Mean
1 30 28 16 34 27
2 14 18 10 22 16
3 24 20 18 30 23
4 38 34 20 44 34
5 26 28 14 30 24.5
Drug
Mean 26.4 25.6 15.6 32 24.9
Source SS
df
MS F
Between S 680.8
4 170.2
Within S 811 15 54.07
Drugs 698.2 3 232.73 24.76
S X D 112.8 12 9.4
Total 1491.8 19
Case Summaries
|
RESPONSE |
SUBJECT |
S1 |
S2 |
S3 |
S4 |
DRUG |
LINEAR |
QUAD |
CUBIC |
CRITER |
| 30 |
1 |
1 |
0 |
0 |
0 |
1 |
-3 |
-1 |
-1 |
108 |
| 14 |
2 |
0 |
1 |
0 |
0 |
1 |
-3 |
-1 |
-1 |
64 |
| 24 |
3 |
0 |
0 |
1 |
0 |
1 |
-3 |
-1 |
-1 |
92 |
| 38 |
4 |
0 |
0 |
0 |
1 |
1 |
-3 |
-1 |
-1 |
136 |
| 26 |
5 |
0 |
0 |
0 |
0 |
1 |
-3 |
-1 |
-1 |
98 |
| 28 |
1 |
1 |
0 |
0 |
0 |
2 |
-1 |
1 |
3 |
108 |
| 18 |
2 |
0 |
1 |
0 |
0 |
2 |
-1 |
1 |
3 |
64 |
| 20 |
3 |
0 |
0 |
1 |
0 |
2 |
-1 |
1 |
3 |
92 |
| 34 |
4 |
0 |
0 |
0 |
1 |
2 |
-1 |
1 |
3 |
136 |
| 28 |
5 |
0 |
0 |
0 |
0 |
2 |
-1 |
1 |
3 |
98 |
| 16 |
1 |
1 |
0 |
0 |
0 |
3 |
1 |
1 |
-3 |
108 |
| 10 |
2 |
0 |
1 |
0 |
0 |
3 |
1 |
1 |
-3 |
64 |
| 18 |
3 |
0 |
0 |
1 |
0 |
3 |
1 |
1 |
-3 |
92 |
| 20 |
4 |
0 |
0 |
0 |
1 |
3 |
1 |
1 |
-3 |
136 |
| 14 |
5 |
0 |
0 |
0 |
0 |
3 |
1 |
1 |
-3 |
98 |
| 34 |
1 |
1 |
0 |
0 |
0 |
4 |
3 |
-1 |
1 |
108 |
| 22 |
2 |
0 |
1 |
0 |
0 |
4 |
3 |
-1 |
1 |
64 |
| 30 |
3 |
0 |
0 |
1 |
0 |
4 |
3 |
-1 |
1 |
92 |
| 44 |
4 |
0 |
0 |
0 |
1 |
4 |
3 |
-1 |
1 |
136 |
| 30 |
5 |
0 |
0 |
0 |
0 |
4 |
3 |
-1 |
1 |
98 |
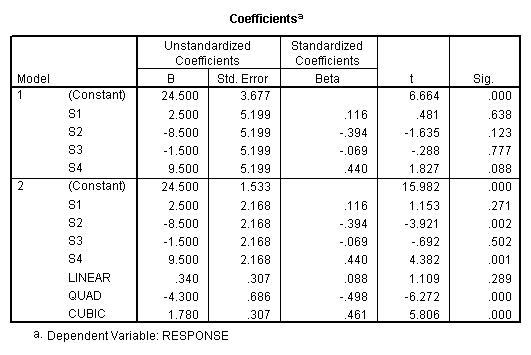
Subjects
as Factors Regression Design: Dummy variables are created to indicate drug
dosage level (here contrast codes were used for Linear, Quadratic, and Cubic
polynomials) and subject (here traditional dummy coding was used for S1, S2,
S3, S4).
As in the traditional analysis, the total sums of squares can be divided into between and within subjects portions. To obtain the sums of squares for subjects, regress the criterion on dummy variables representing the subjects. To obtain the sums of squares for the within subjects effects, regress the criterion on dummy variables representing the subjects and the within subjects factors. Then subtract the total sums of squares obtained. The difference in the sums of squares is the sums of squares for the added factors.
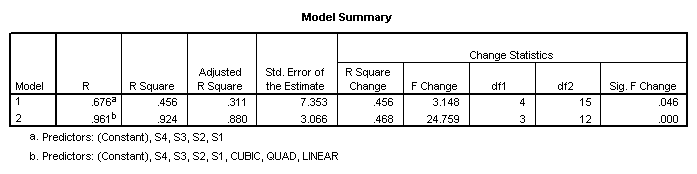
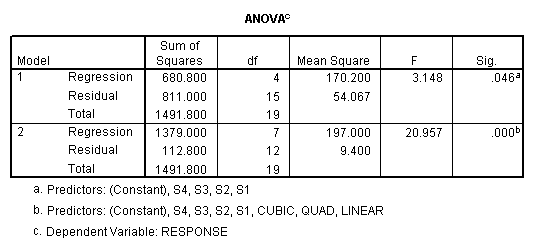
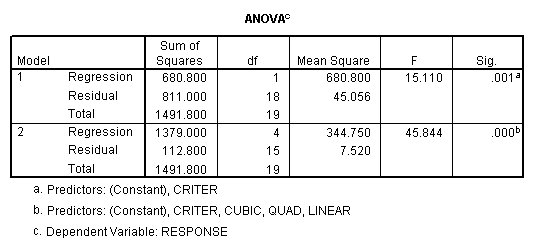
The sums of squares for subjects (680.8)
is obtained from the first regression model (which includes only
subjects). The residual sums of squares
(811) is the within sums of squares.
The sums of squares explained in the second regression model (1379.0)
represents the sums of squares due to subjects (S1, S2, S3, and S4) and the
drug dosage levels (Linear, Quad, Cubic). The difference between these two sums
of squares is the sums of squares due to the added factors, i.e., the effect of
drug dosage (1379-680.8=698.2). The
residual sums of squares from this second model is the sums of squares for the
only remaining effect – the subjects by treatment (drug dosage level)
interaction. The numbers obtained by
this analysis are the same as those given by the traditional analysis (see
above).
Criterion
scaling Design. To represent the effects of subjects,
create a new variable that is the mean (or sum – it differs from the mean only
by a constant) of the criterion values for each subject across all of the
within subjects conditions. Then
regress this variable on the criterion.

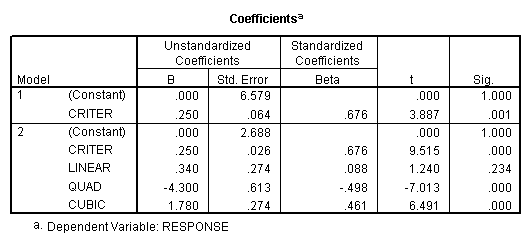
Then proceed as
before. The sums of squares for
subjects (680.8) is obtained from the first regression model (which includes
only subjects). The residual sums of
squares (811) is the within sums of squares.
The sums of squares explained in the second regression model (1379.0)
represents the sums of squares due to subjects (CRITER) and the drug dosage
levels (Linear, Quad, Cubic). The difference between these two sums of squares
is the sums of squares due to the added factors, i.e., the effect of drug
dosage (1379-680.8=698.2). The residual
sums of squares from this second model is the sums of squares for the only
remaining effect – the subjects by treatment (drug dosage level)
interaction. The numbers obtained by
this analysis are the same as those given by the traditional analysis and the
subjects-as-factors regression (see above).
However, the degrees of freedom given in the regression run are wrong
because the program treats CRITER as having only 1 degree of freedom when in
reality subjects should have n-1 degrees of freedom. So, to obtain the correct mean squares and F ratios, correct the
degrees of freedom, calculate the correct mean squares and F tests.
Corrected
Statistics:
SOURCE SS DF MS F
P
Subjects 680.800 N-1=4 170.2 3.148
Within S 811.000 #Obs-dfS-1=15 54.067
Drugs 811.0-112.8=698.2 C-1=3 232.73 24.76
S X Drugs 112.800
#Obs-dfS-dfC-1=12 9.400
Tests of the
trends can also be obtained from the results above by proceeding hierarchically
to obtain the requisite sums of squares or by correcting the printed t-tests:
![]() where C=number of
conditions
where C=number of
conditions
Either of the above approaches can be used with
multiple predictors in addition to the dummy variables indicating treatment
and/or group membership.
C. Example
of ANCOVA using regression approach and criterion scaling (Winer, p. 806)
SR(AF) X BF with
one covariate changing over trials.
1. Data
|
Group |
Subject |
B1 |
B2 |
Total |
|||
|
|
|
X |
Y |
X |
Y |
X |
Y |
|
A1 |
1 |
3 |
8 |
4 |
14 |
7 |
22 |
|
|
2 |
5 |
11 |
9 |
18 |
14 |
29 |
|
|
3 |
11 |
16 |
14 |
22 |
25 |
38 |
|
A2 |
4 |
2 |
6 |
1 |
8 |
3 |
14 |
|
|
5 |
8 |
12 |
9 |
14 |
17 |
26 |
|
|
6 |
10 |
9 |
9 |
10 |
19 |
19 |
|
A3 |
7 |
7 |
10 |
4 |
10 |
11 |
20 |
|
|
8 |
8 |
14 |
10 |
18 |
18 |
32 |
|
|
9 |
9 |
15 |
12 |
22 |
21 |
37 |
2. Analysis.
a. Create
new variables
TX=Total X value summed across treatments for one
subject.
TY=Total Y value summed across treatments for one
subject
b. Perform
hierarchical regression treating each observation on each subject for each
treatment as a separate case:
|
Predictors |
SS |
Residual SS |
Terms Added |
Change in SS |
|
TX |
178.371 |
196.129 |
TX |
178.371 |
|
A+TX |
232.630 |
141.870 |
A |
54.259 |
|
A+TX+TY |
277.000 |
97.5 |
TY |
44.37 |
|
A+TX+TY+X |
339.745 |
34.755 |
X |
62.475 |
|
A+TX+TY+X+B |
369.163 |
5.337 |
B |
29.418 |
|
A+TX+TY+X+B+A*B |
371.502 |
2.998 |
A*B |
2.339 |
c. Use sums of squares obtained from this analysis
in constructing a traditional MS table:
|
Source |
SS |
df |
MS |
F |
|
Average X |
178.371 |
1 |
|
|
|
A |
54.259 |
2 |
27.13 |
3.06 |
|
S(A) |
44.37 |
6-1 |
8.87 |
|
|
X |
62.475 |
1 |
|
|
|
B |
29.418 |
1 |
29.418 |
49.03 |
|
A*B |
2.339 |
2 |
1.16 |
1.93 |
|
S(A)B |
2.998 |
6-1 |
0.600 |
|
d. Note that
the results obtained using this method may differ slightly from those obtained
using other approaches. There is some
debate over the best approach to repeated measures ANCOVA.
e. With a
covariate that does not change over trials, the same steps may be followed --
omitting the “X” variable of course!