Dreiling's 3-D Corporate Network Gallery
The images below are part of a test effort to use molecular modeling
graphics to represent the structure of intercorporate relations as they
are manifest in three-dimensional space. Each node depicts a corporation
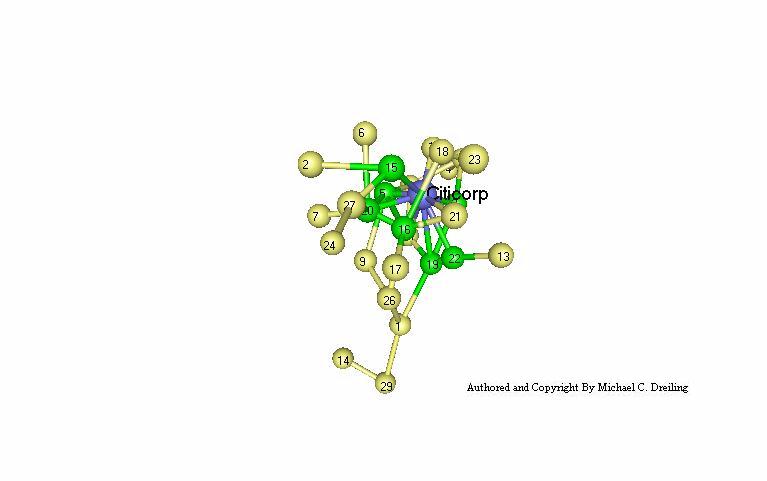
and an arc between two nodes indicates a common linkage. The first image
depicts the board of director interlocks (common board members) among 30
corporations. Those with more links are considered to be more
central, as is clear in the case of Citicorp. If your web browser
has Virtual Reality Modeling Language (VRML) capacity, then you may link
to this image and explore its 3-dimensional properties. If you would like
to add a VRML plug-in to your browser, go to the VRML
Repository. It is very
interesting stuff. The second, third, and fourth images are
perspectives on two different policy networks involving the same corporations.
If you want skip the 3-dimensional depictions, then follow this link to my NEXT PAGE with 2-dimensional plots of similar corporate networks.
Board interlocks (link to wrl 3-dimensional graphic,
or click the image)
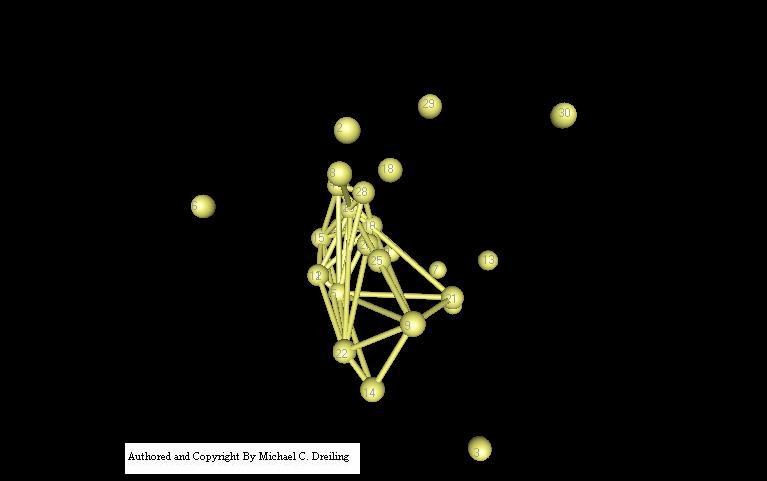
The graph below represents common ties greater than 4 among 30 corporations in 8 major policy associations (See Figure 3 below). If all overlaps (or common memberships to the policy advocacy organizations) were included in this graph, only 1 of the 30 corporations remain isolated. Depicting the network of full ties in 3-dimensions is simply too "jumbled." Hence the reason for graphing only those ties where more than 4 common overlaps occur. As Figure 2 exhibits, it is pretty clear that these corporations "hang together" as members of organizations sharing common policy concerns.
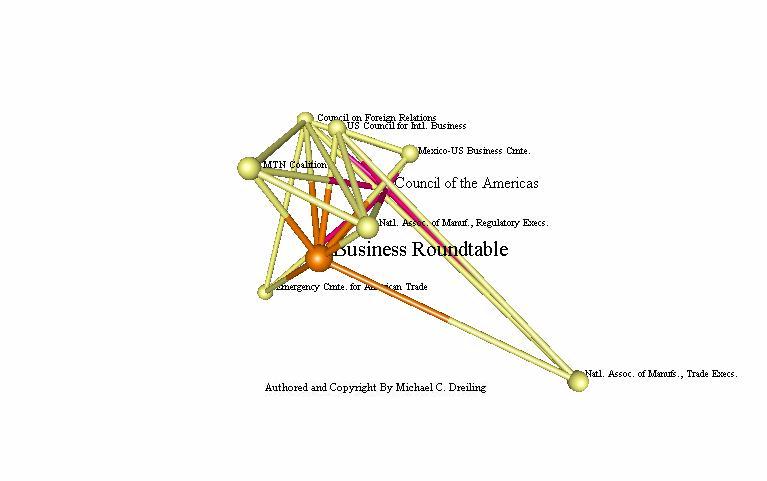
Now here (below) are the 8 policy planning organizations plotted with coordinates from a correspondence analysis. Note that all of these influential business assocations are linked together by the executives of only 30 corporations. (also note that there are two different committees from the National Association of Manufacturers -- NAM -- making a total of 9 nodes, though still eight policy bodies).
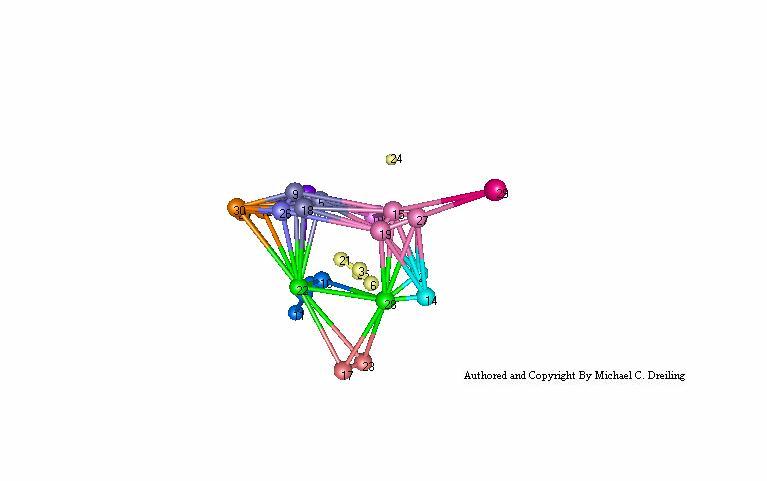
And here are the same 30 corporations "tied together" in the Trade Advisory Committees of the U.S. Trade Representative (1992). It is clear that the executives of these corporations are able to obtain non-elected, direct representation as advisors to the President of the U.S. and the USTR and consequently influence the direction of U.S. trade policy. Again, only 30 corporate executives are represented here! Many more are involved in this process.
I hope you have enjoyed the visit. Sometime down the road, I will manicure these images, expand the networks, and the number of corporations involved.
Return to homepage.
Copyright © Michael Dreiling, 2002. All rights reserved.